
01 / Supply, measured
Competitor inventory, REIT and non-REIT operators, and the permit pipeline.
Distance-weighted comps and construction activity show what is already competing for the same renter or tenant, and what is about to.
Competitor counts and demographic tables are not a market view by themselves. Atlas fuses a proprietary blend of high-quality sources into one verdict: where rates sit today, where they can go, and whether the market actually supports the price.
No card. 10 free credits. Cancel anything anytime.
Distance-weighted comps and construction activity show what is already competing for the same renter or tenant, and what is about to.
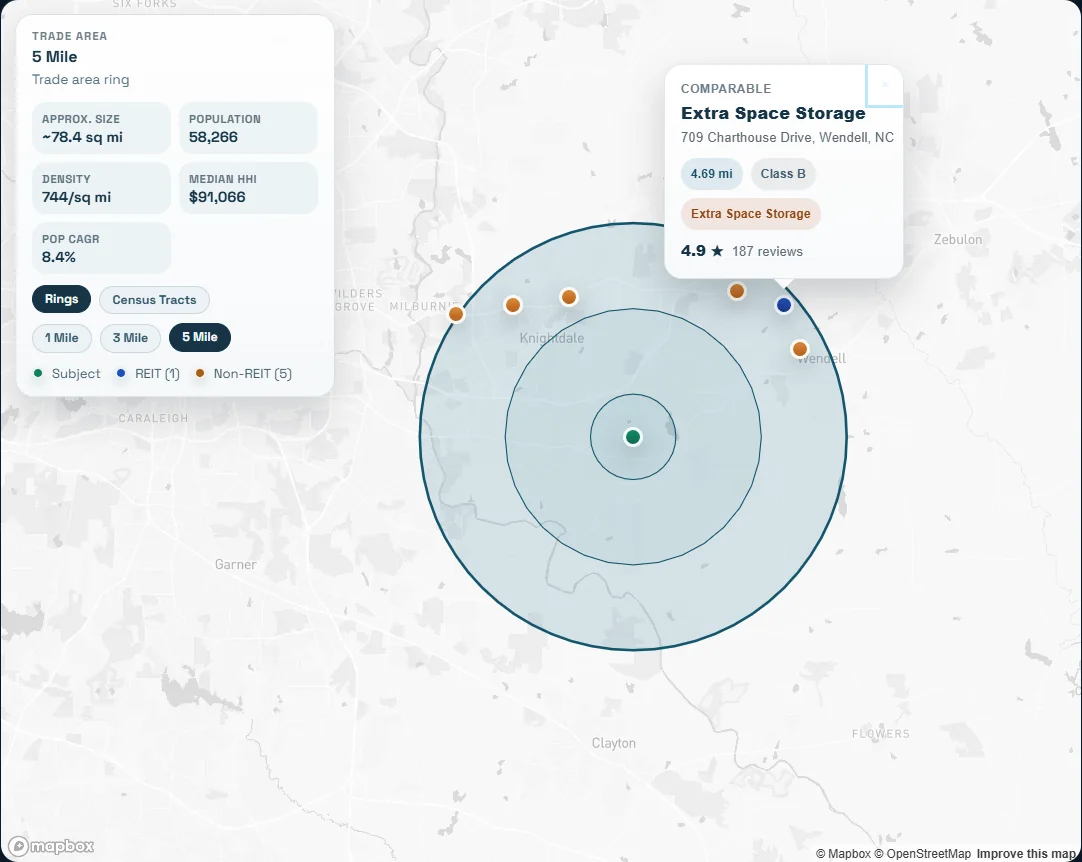
Demand is measured at 1, 3, and 5 miles so the model reflects the property's actual market, not a citywide average.
Supply and demand come together into a position: is this asset priced below, at, or above what its market can support.
Radius rings, demographic snapshots, and competitor markers make the geography tangible instead of a paragraph of description.
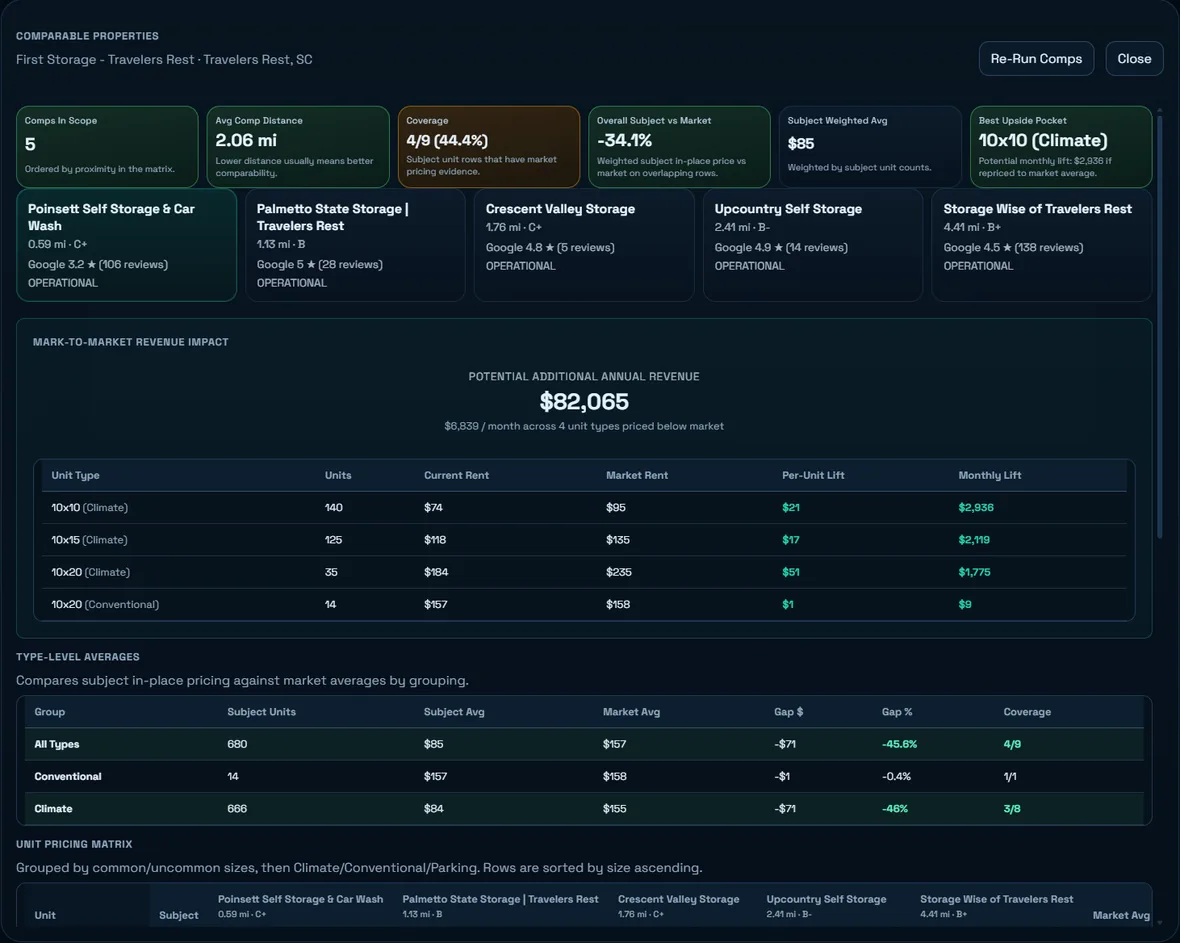
The comps matrix ties subject-vs-market rent gaps into a revenue-impact estimate instead of a static list of nearby facilities.
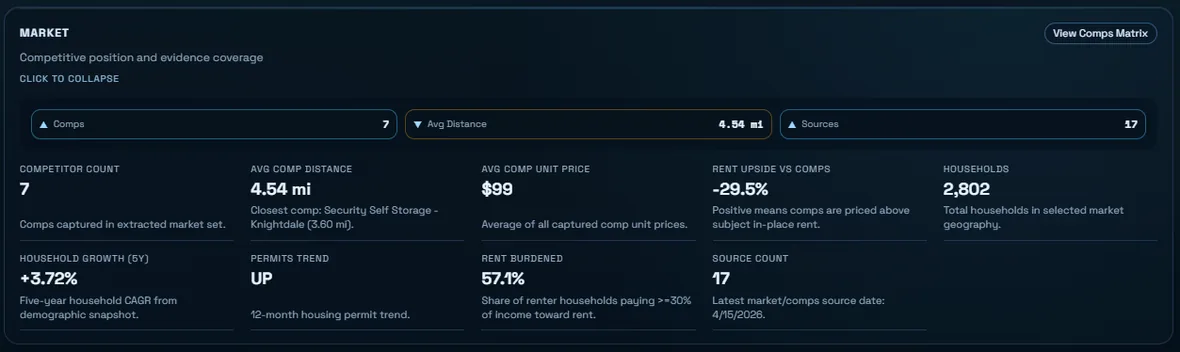
Comp counts, average distance, rent-upside signals, and source coverage help defend the market thesis with numbers, not adjectives.
The downloadable sample uses Atlas Deal Room's existing seeded product demo. Its facility and values are clearly labeled illustrative. The report shows the real output arc without passing demo numbers off as market proof.
Atlas fuses live competitor rate checks, demographic and household data, permit and construction pipeline signals, and rent-burden data for the market around the specific address you enter.
The supply-and-demand approach applies to both. Self-storage is fully supported today; multifamily coverage is expanding.
Market context is generated as part of running a property through Atlas. Start free to see it against a real address.