
Step 01
Upload the broker package
Start with the OM, rent roll, T-12, photos, and supporting files. Atlas turns the materials you already have into an organized deal record.
Atlas Deal Room turns scattered storage deal materials into a structured, visual workflow: intake, extraction, market evidence, underwriting, scenario testing, and polished outputs. The result is one deal room built for teams that need to move fast without losing the source of truth.
No card. 10 free credits. Cancel anything anytime.
The demo shows the same operating model reflected across the product: one deal record, one source of truth, and outputs that stay connected to the numbers behind them.
Atlas Deal Room does not treat analysis, market evidence, scenarios, and reporting as separate chores. It pulls them into a single flow so your team can underwrite, explain, and share the deal with far less rework.
Start with the OM, rent roll, T-12, photos, and supporting files. Atlas turns the materials you already have into an organized deal record.
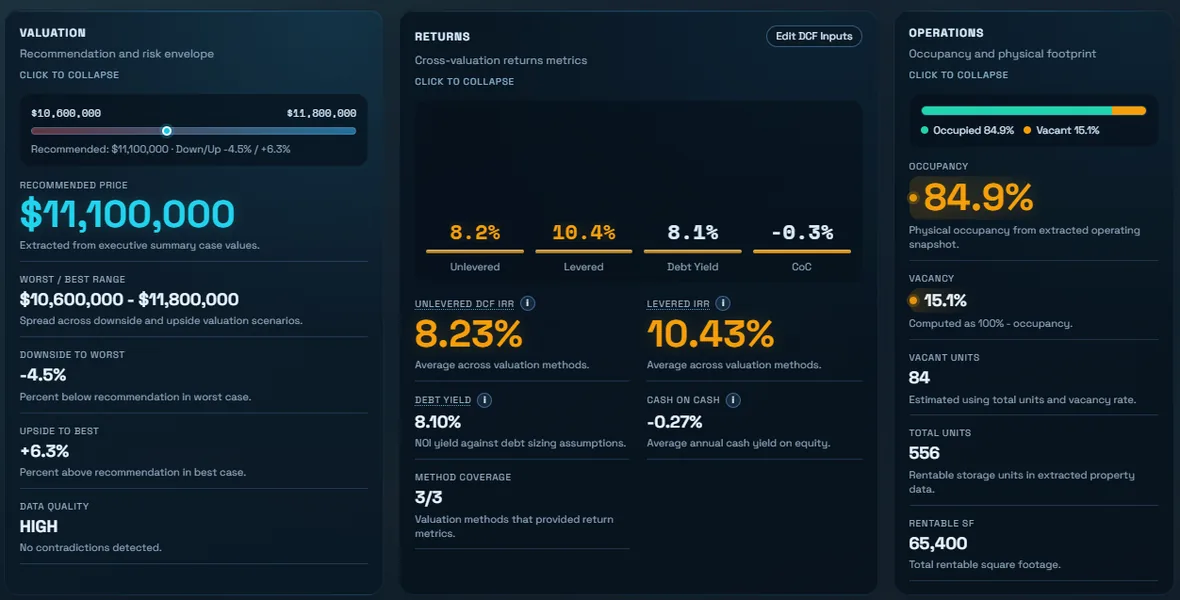
Property facts, unit mix, valuation ranges, returns, occupancy, and data-quality markers sit in one place so teams can review the deal quickly.
Competitor pricing, local demographics, source coverage, and map context are attached to the asset instead of buried in side research.
Adjust entry assumptions, operating posture, cap rates, vacancy, rent growth, and debt outcomes while the return story updates in the same workspace.
Generate executive summaries, market reports, slide decks, LOIs, and marketing packages from the same deal record decision-makers already reviewed.
Valuation, return profile, occupancy, NRSF, units, and data-quality context are displayed together so the team can see the investment shape immediately. The page makes the high-value questions obvious: price, downside, upside, return strength, and operating footprint.
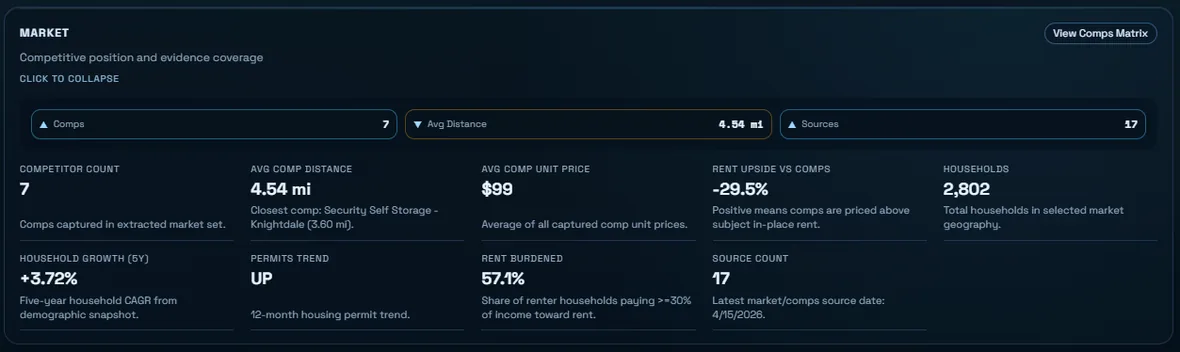
Competitor counts, average comp distance, rent-upside signals, household data, permit trends, rent burden, and source coverage help teams defend the market thesis with numbers that sit next to the asset, not in a disconnected research file.
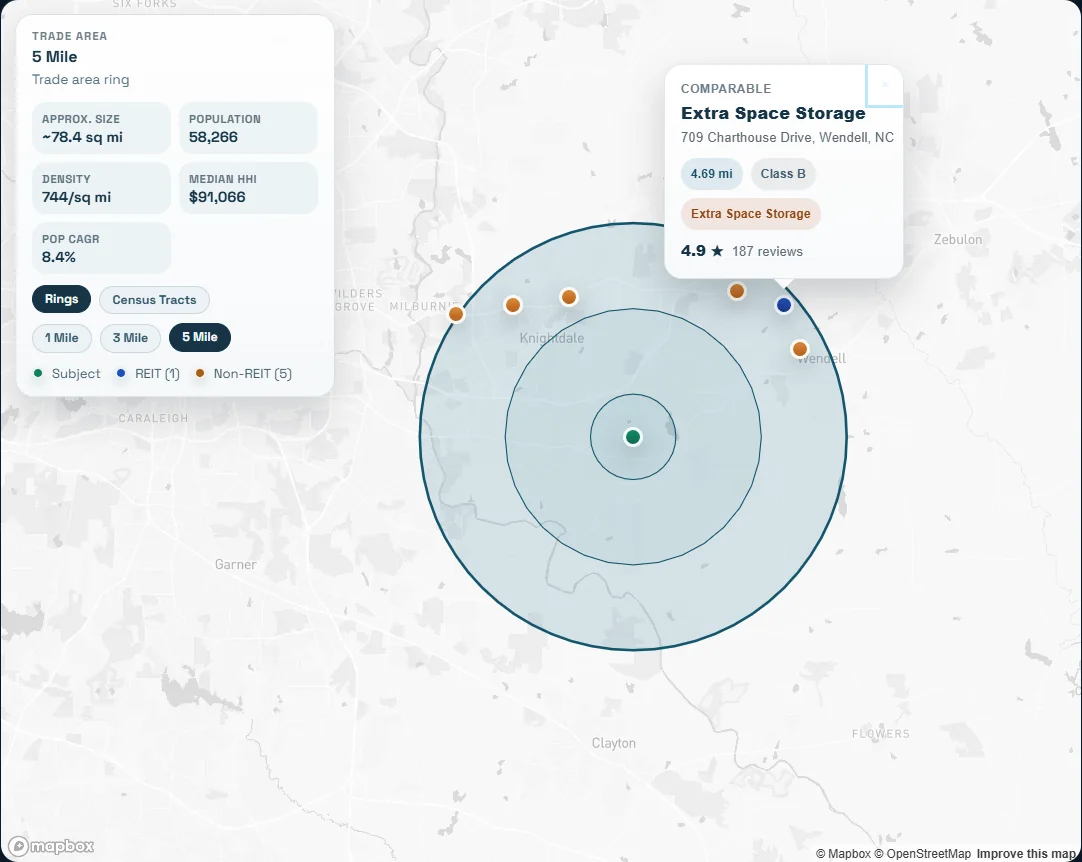
Radius rings, demographic snapshots, subject markers, REIT and non-REIT competitors, and comp detail cards make the geography tangible. This is the kind of visual context that helps an IC, lender, or partner understand why the location matters.
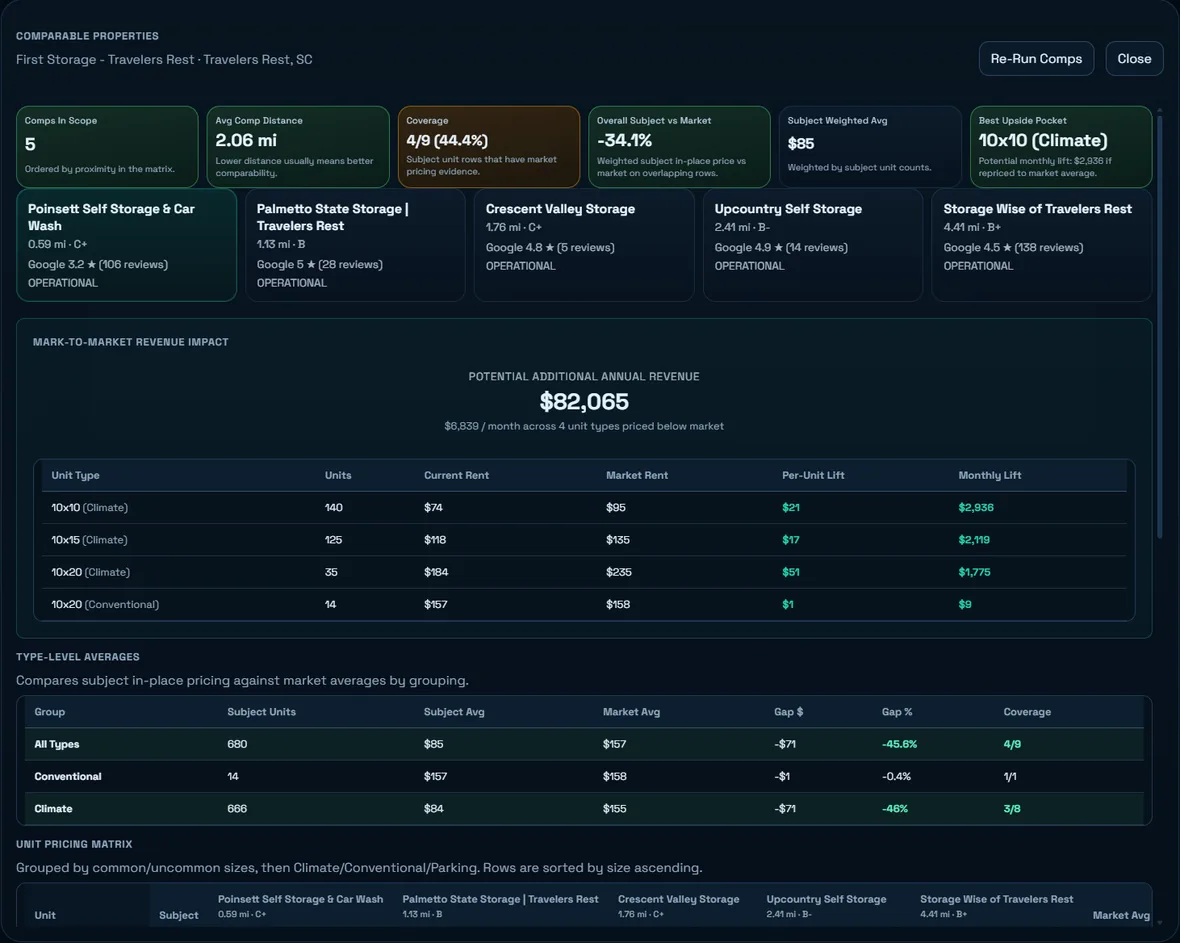
The comps matrix does more than list nearby facilities. It ties distance, quality, coverage, subject-vs-market rent gaps, and mark-to-market revenue lift into a table your acquisitions team can actually use.
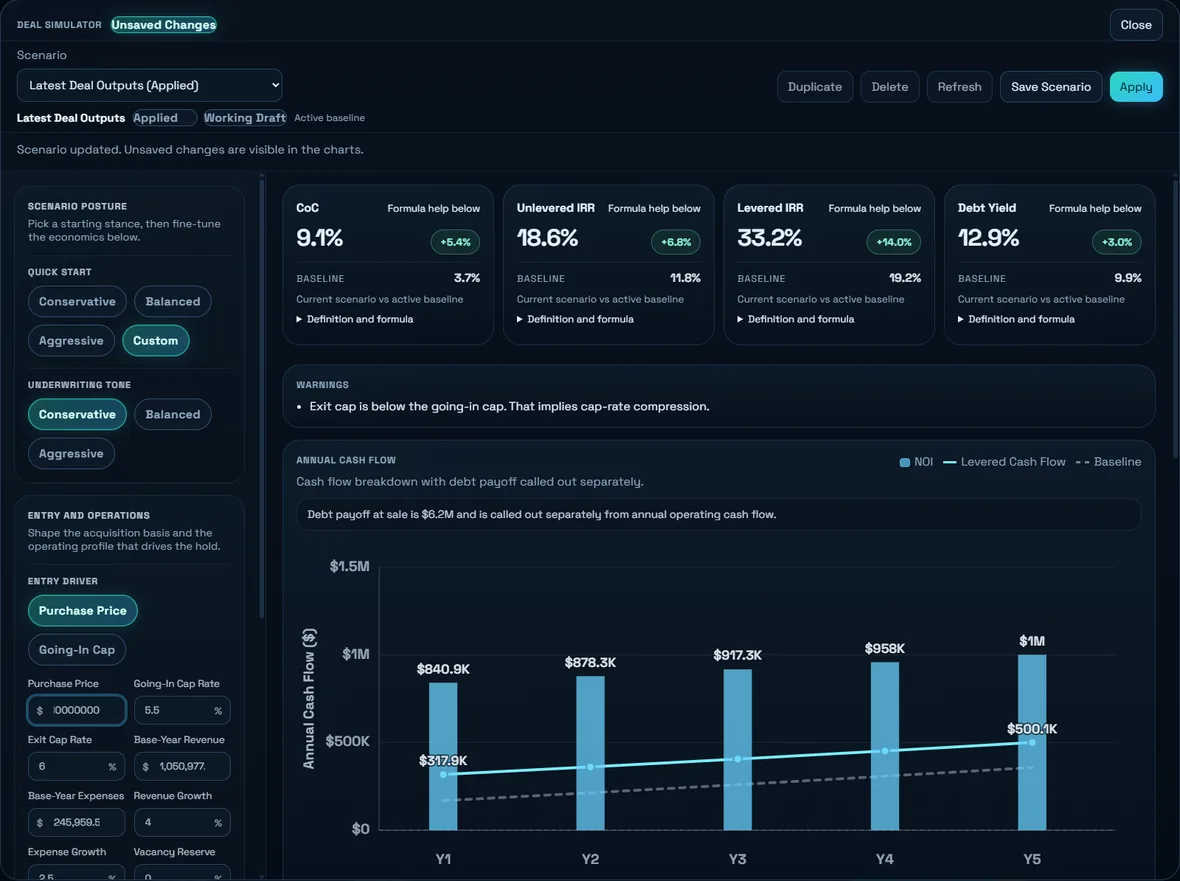
Conservative, balanced, aggressive, and custom scenarios let teams test purchase price, cap rates, revenue growth, expense growth, and vacancy assumptions while seeing return deltas, warnings, and cash-flow impact in one workspace.
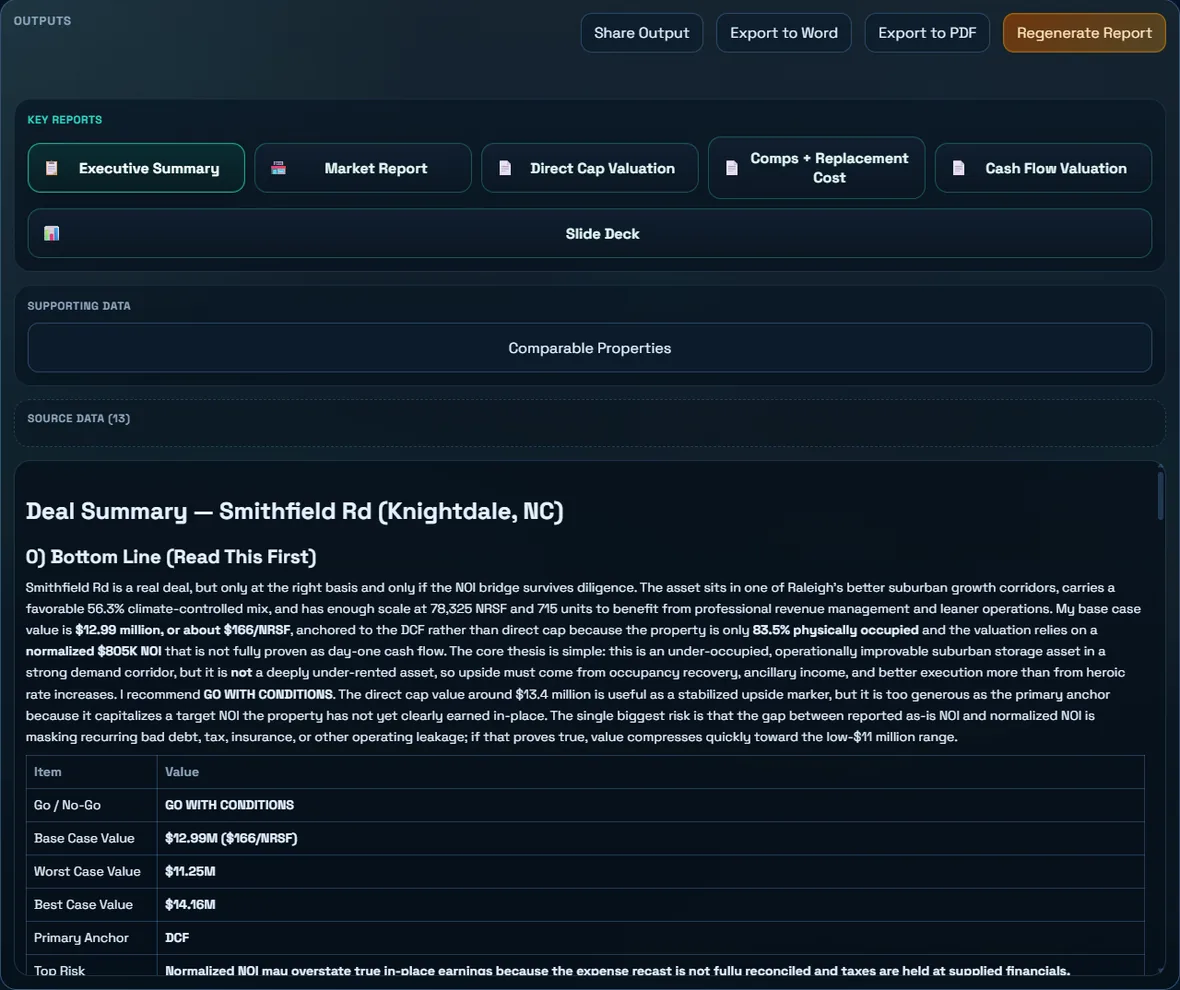
Executive summaries, market reports, direct cap valuation, comps and replacement cost, cash-flow valuation, slide decks, Word exports, PDFs, and share links come from the same structured deal. That is why the final package is faster to produce and easier to defend.
Atlas Deal Room is built around the moments when buyers, partners, lenders, and operators ask hard questions. The platform keeps the answer close to the source material, the market evidence, and the latest scenario work.
Analysts, principals, lenders, and partners can orient around one workspace instead of stitching together files, screenshots, and memo drafts.
That matters when a recommendation, valuation, rent-upside claim, or downside case needs to be explained under pressure.
Executive summaries, slide decks, LOIs, marketing packages, lifecycle follow-through, and portfolio context can all stay tied to the asset.